How to dimensionally reduce data for the purposes of visualization
Jan 17, 2025
Dimensionality reduction is about taking high-dimensional data (like 1000 features) and mapping it into fewer dimensions (usually 2 or 3) so we can see patterns more easily. Here are some popular methods:
- PCA (Principal Component Analysis):
- Looks at the covariance matrix of your data.
- Finds the directions (components) that explain the most variance.
- Works best when data relationships are mostly linear.
- UMAP (Uniform Manifold Approximation and Projection):
- Builds a graph of your data points based on local neighborhoods.
- Preserves both local structure and some global structure too.
- Often faster than t-SNE and can handle large datasets well.
- SVD (Singular Value Decomposition):
- A more general matrix factorization tool.
- Closely related to PCA when applied to centered data.
- Commonly used in image compression and recommendation systems.
- t-SNE (t-Distributed Stochastic Neighbor Embedding):
- Great for visualizing clusters (like different categories of images or texts).
- Tries to preserve local relationships by converting distances into probabilities in both the original and reduced spaces.
- Uses an iterative optimization to make sure points that are similar stay close together in the lower dimension.
- Often produces very nice cluster separations but can be slower for large datasets.
How does t-SNE work?
t-SNE takes each pair of points in the high-dimensional space and measures how similar they are. These similarities become probabilities. Then, it creates a similar set of probabilities in a lower-dimensional space and uses optimization (gradient descent) to minimize the difference between the two. This way, points that were close in high-dimensional space remain close, and points that were far remain far, preserving local structures and forming distinct clusters.
Here’s a good blog post about t-SNE.
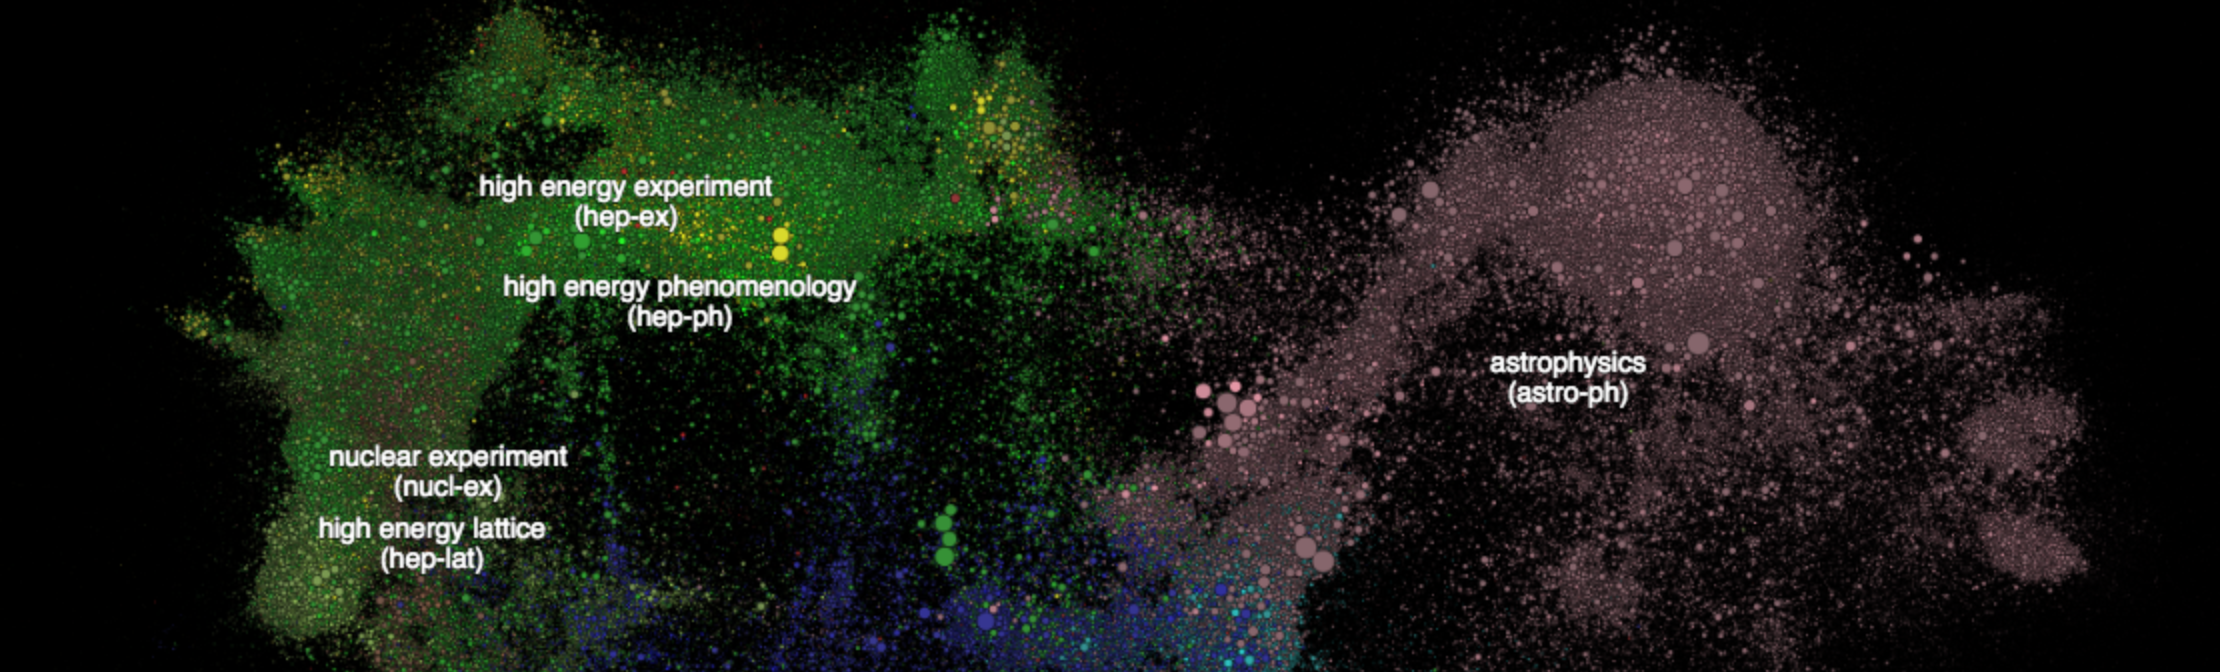
t-SNE visualization of a small slice of human knowledge (from paperscape). Each circle is an arXiv paper, with size showing citation count. Source: Karpathy’s Blog.